We Built the Same App in KMP and React Native – Here's What We Found
 Artur Gęsiarz
 Karol Kąkol
 Weronika Grzybowska
TL;DR
The debate between Kotlin Multiplatform (KMP) and React Native (RN) touches on many dimensions – developer experience, ecosystem maturity, team fit. We wanted to add measured performance data to that picture, so we built the same application twice to see how each stack impacts the final product.
Our findings show that there is no "perfect" framework; instead, each technology offers a different performance profile. React Native continues to be a powerhouse for iOS memory efficiency and fast iterations, while Kotlin Multiplatform shows remarkable lean-ness on Android across metrics such as app size, startup times, and RAM usage.
Let's look at the raw metrics to help you take an data-driven look at how these technologies behave in real-world scenarios!
The apps
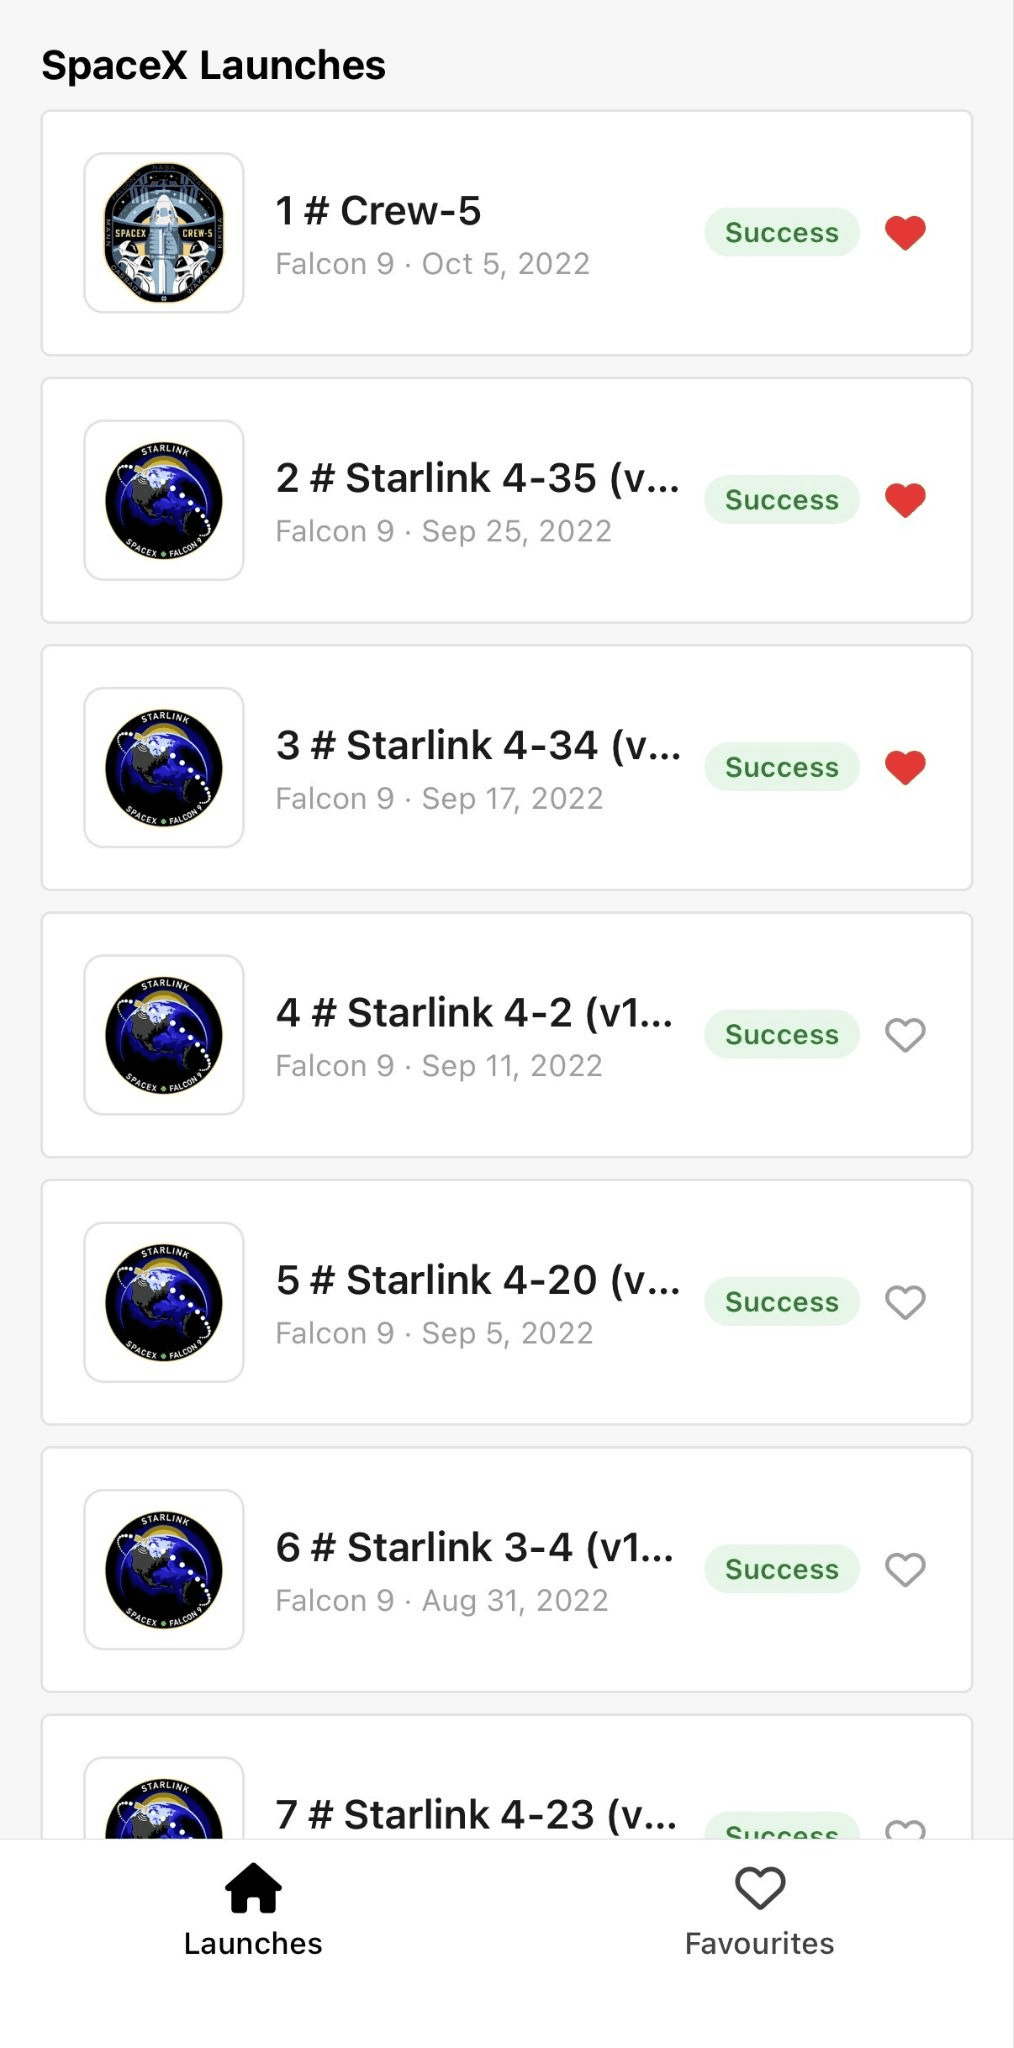
In order to compare the two frameworks, we created a simple app that lists recent SpaceX launches. We prepared separate implementations: one built with Kotlin Multiplatform and Compose Multiplatform, the other with React Native and Expo.
Both apps fetch from the public SpaceX API and present a list-and-detail interface that exercises the runtime in the same way most production apps do: networked data, image loading, list virtualization, local persistence, navigation between tabs.
The app consists of three key components:
Launches: a scrollable list of SpaceX launches with mission patches, dates, and rocket info.
Favourites: a view displaying favourited launches, handled via local persistence.
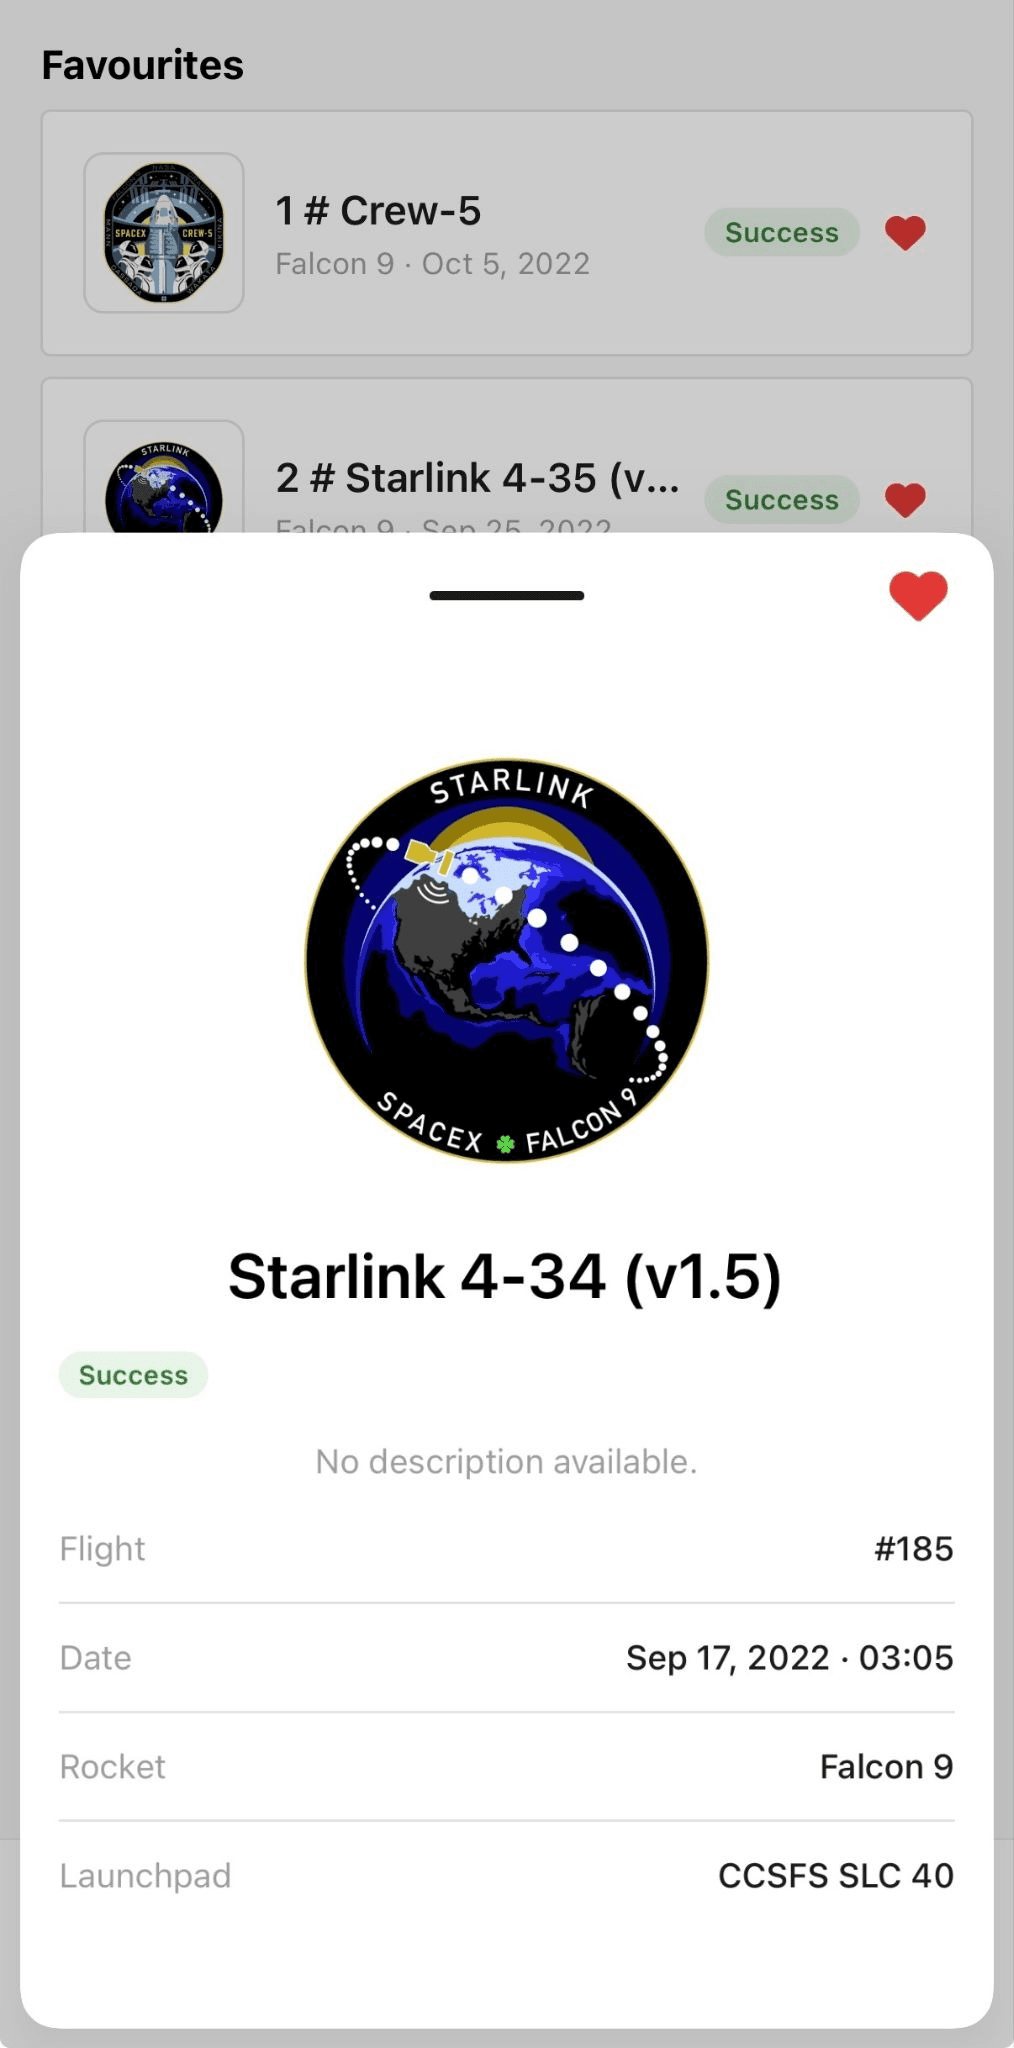
Detail sheet: a modal bottom sheet that opens from either tab to fetch and render launch images and extended details.
An important caveat up front: both implementations are baseline – not fully tuned for production. We deliberately use what the framework gives us out of the box: no hand-tuned native escapes, no custom shadow nodes, no overrides of the default list virtualization, no aggressive image preloading. The intent is to measure the cost of the framework defaults - the starting point any team would have on day one – not the cost of optimization effort.
Tech stack
Kotlin Multiplatform:
Kotlin 2.3.0
Compose Multiplatform 1.10.0
Ktor 3.1.3 – networking
Coil 3.1.0 – image loading
Voyager 1.1.0-beta03 – navigation
Room 2.8.4 – local persistence
kotlinx-serialization 1.8.1 – JSON
React Native:
React Native 0.81.5 on Expo 54.0.33
Axios 1.13.6 – networking
TanStack React Query 5.90.21 – data fetching and caching
Zustand 5.0.12 – favourites state
Expo Image 3.0.11 – image loading
Expo Router 6.0.23 + React Navigation 7.1
Test scenario
To measure the performance of each framework, we created a scenario which is aimed at key architectural components:
Long list rendering
Image cache management
Database operations
You can watch the full execution of the test below:
The step-by-step sequence:
Initial interaction: pen the first list item, fully expand the bottom sheet, and save the object to the database (mark as favorite).
Mid-list scroll & render: rapidly scroll to the 25th item, interact with the UI, and toggle the favorite status.
End-of-list stress test: scroll to the very bottom of the list-forcing the framework to handle on-the-fly asset loading for the entire dataset and favorite the final item.
State & database management: navigate to the "Favorites" tab and successively remove all saved items from the database.
Reset: navigate back to the primary list and return the scroll position to the top.
Test devices
We conducted all measurements across a diverse set of six devices, with results reported on a per-device basis to highlight hardware-specific performance variance.
Android:
Pixel 7 – 2022, Tensor G2, 8 GB RAM.
Motorola Edge 60 – 2025, MediaTek Dimensity 7300, 8 GB RAM.
Huawei P40 Lite – 2020, Kirin 810, 6 GB RAM.
All Android builds: release configuration, R8 + ProGuard shrinking and obfuscation enabled, single ABI (arm64-v8a) so framework size is not conflated with multi-arch shipping decisions.
iOS:
iPhone 13 mini – 2021, A15 Bionic, 4 GB RAM
iPhone 16 – 2024, A18, 8 GB RAM
iPhone 17 – 2025, A19, 8 GB RAM
All iOS builds: release configuration, Ad-Hoc distribution, Debug Executable disabled so the OS gives us realistic app launch and runtime behavior.
The challenges of profiling
Precise performance benchmarking often requires repeated test cycles to ensure statistical consistency. Our first step was to automate this process using Maestro, aiming to capture profiler output across all devices without manual intervention.
However, once the results came in, RAM and CPU numbers were drifting in ways that didn't match what we saw running the app by hand.
The issue turned out to be the overhead introduced by the automation itself. Adjusting the method used to access the application UI allowed us to reduce it, but the difference was still too large for our purposes.In light of this, we decided to perform the RAM and CPU scenario manually.
That said, we didn't have to throw out everything – the interaction with the device had to be done by hand, but the majority of the process stayed automated via CLI tools.
Round 1 – app size
App size is critical because larger apps can discourage users from downloading them, especially over cellular data. We track two different values for each platform to show the difference between the compressed download package and the final app size on the device.
What we measure
Let’s focus on two figures:
Download size – the estimated amount of data transferred over the network (compressed).
Installed size – the final footprint of the app on the device (uncompressed).
How we measured
On Android, we built a release APK and inspected it with Android Studio’s APK Analyze.
We used the gradlew command to generate the release APK:
./gradlew assembleReleaseOn iOS, we archived the app for Ad-Hoc distribution and analyzed the App Thinning Size Report generated by Xcode during the export process. It breaks down compressed (download) and uncompressed (installed) size per device variant.
The numbers – table
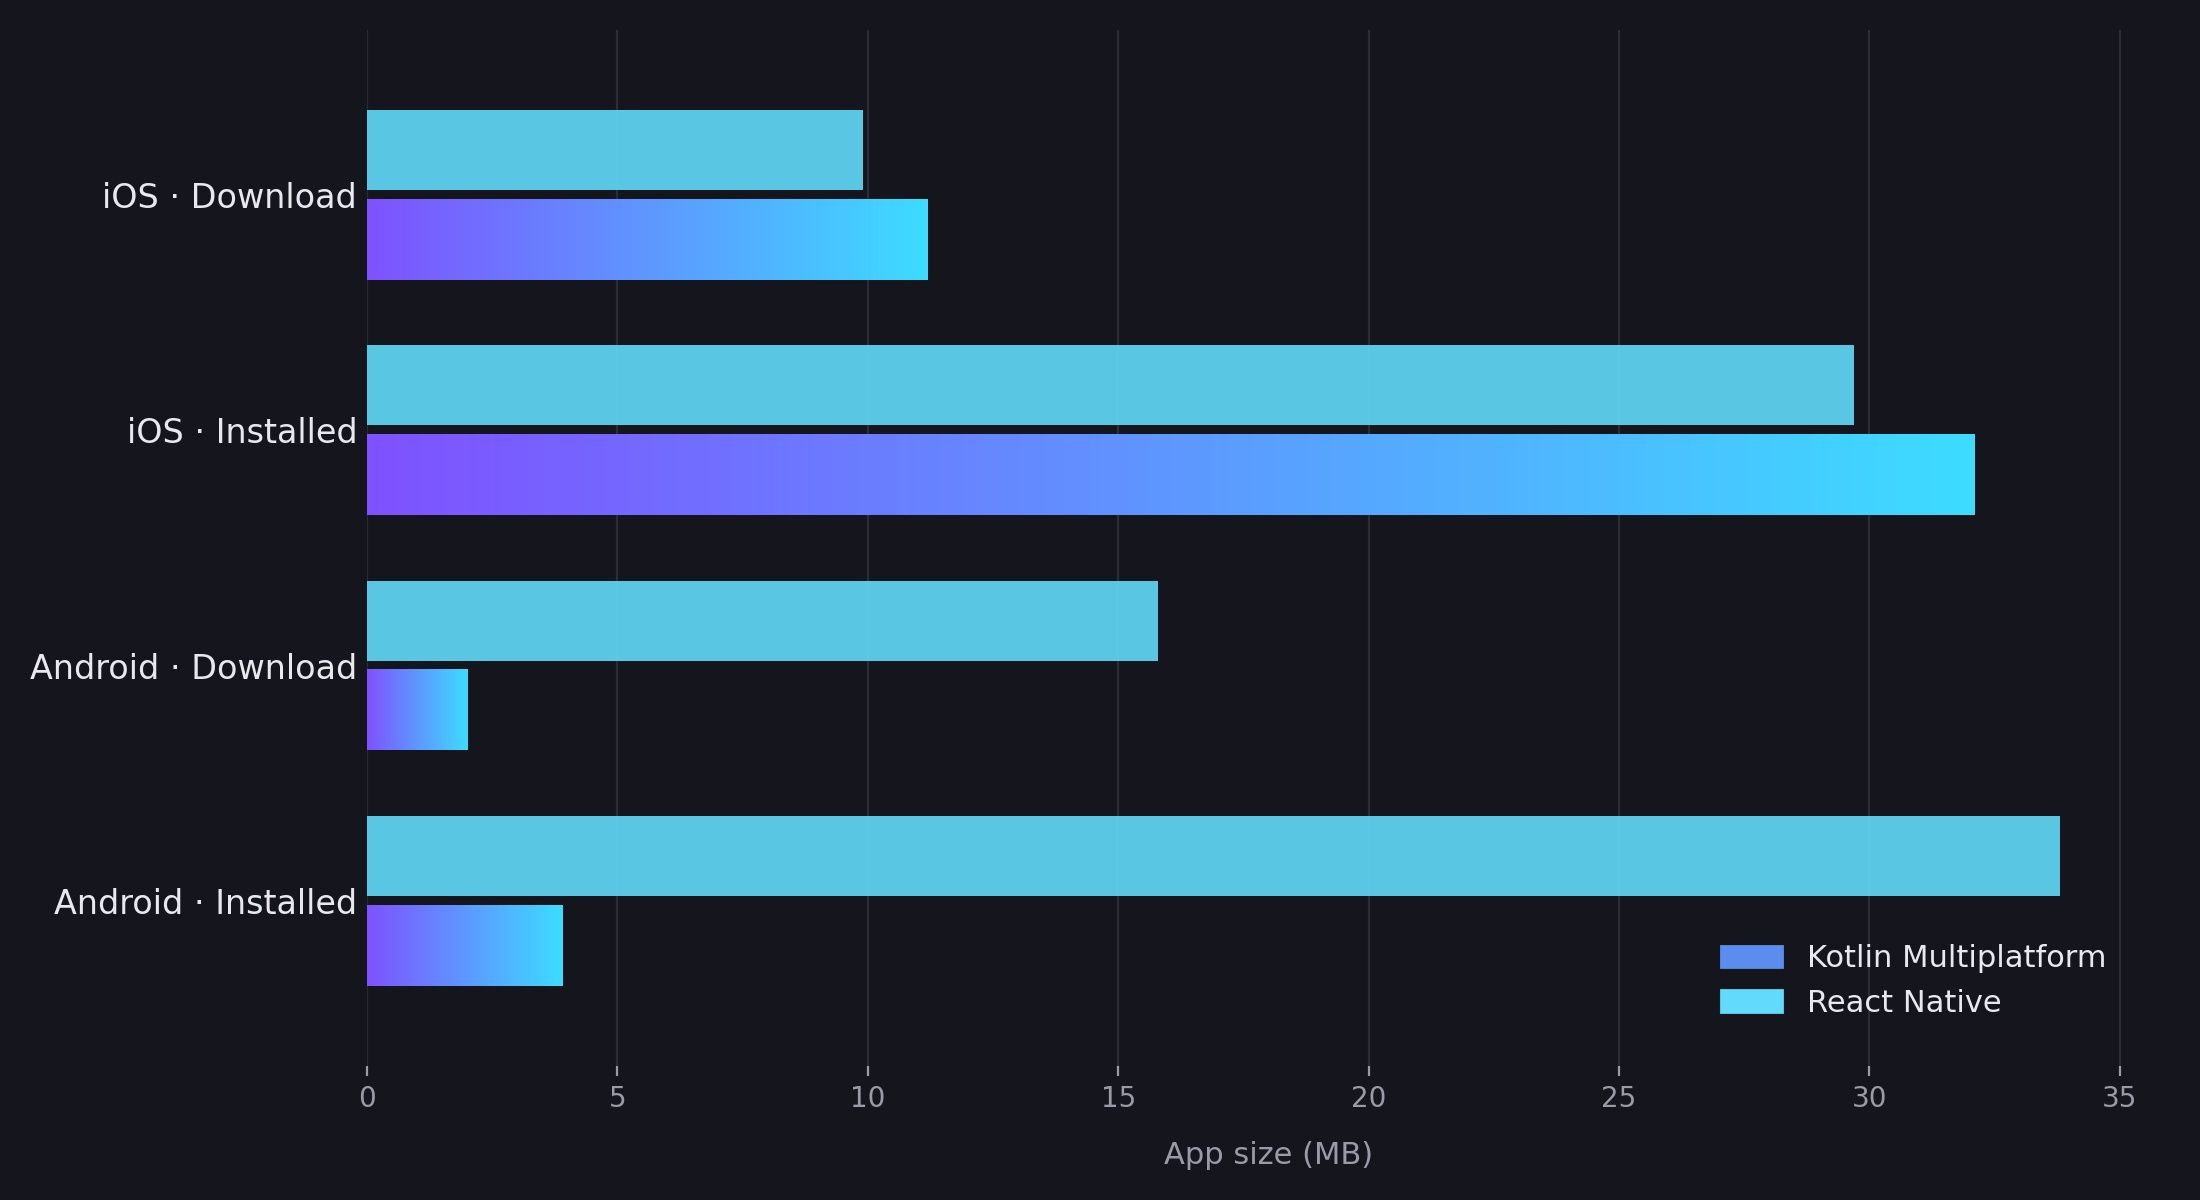
| Platform | Framework | Download size | Installed size |
| Android | Kotlin Multiplatform | 2.0 MB | 3.9 MB |
| Android | React Native | 15.8 MB | 33.8 MB |
| iOS | Kotlin Multiplatform | 11.2 MB | 32.1 MB |
| iOS | React Native | 9.9 MB | 29.7 MB |
The numbers – Android
The most significant disparity appears on Android, where KMP is roughly 8x smaller than React Native. While R8 optimization applies to both, its impact is asymmetric.
For KMP, R8 operates directly on Kotlin bytecode and aggressively prunes unused Compose and library code.
For React Native, R8 can only process the Java/Kotlin native layer – it has no access to the JavaScript bundle, which is a separate artifact compiled by the Hermes engine. The heavy baseline of Hermes, JSI, and the JS bundle ships regardless of app complexity.
The numbers - iOS
On iOS, the story is different. The download sizes land within ~1.3 MB of each other, with React Native slightly ahead.
For Compose Multiplatform, iOS ships its own Skia-based renderer, Kotlin bindings to Google's Skia, plus the Kotlin/Native runtime compiled to ARM64.
For React Native, rendering is handled by native UIKit at no binary cost, but the framework compensates with Hermes, the JavaScript bundle, and the JSI bridge layer.
The two runtimes are architecturally different, but their size footprints converge in practice.
Round 2 – startup time
Startup time directly affects retention and store visibility. We track this metric to compare how quickly each framework can reach its first frame from a cold start.
What we measure
TTID (Time to Initial Display) – measured from the launch tap to the first rendered frame of the UI.
TTFD (Time to Full Display) – measured from the launch tap to the point where the app has loaded its content and is fully interactive.
How we measured
Startup time is measured across two distinct milestones: TTID and TTFD. Both are captured per cold start, meaning the app is fully terminated before each measurement.
The general method is as follows:
Force-terminate the app
Start recording
Launch the app
Record TTID when the first frame appears
Wait for the TTFD signal
Unlike CPU profiling (which we will cover in detail later), the recorder starts before the launch - the point is to capture the startup itself.
For Android, the `am start -S -W` command drives each cold start and blocks until the first frame is rendered, returning TTID directly.
adb shell am start -S -W <package>/.MainActivity \
    -c android.intent.category.LAUNCHER \
    -a android.intent.action.MAIN
TTFD is read from logcat, where Android emits a "Fully drawn" log entry after the app calls reportFullyDrawn(). This function is invoked once the UI has finished loading all content - in this case, when the launch list data request settles with either a success or an error.
adb logcat -d | grep "Fully drawn <package>"
For iOS, the measurement uses xctrace with the App Launch template and the Points of Interest instrument:
xcrun xctrace record \
  --template "App Launch" \
  --instrument "Points of Interest" \
  --output startup.trace \
  --device <UDID> \
  --time-limit 5s \
  --launch -- <bundle_id>
The trace is then exported to XML, filtering for the os-signpost table in the PointsOfInterest category:
xcrun xctrace export \
  --input startup.trace \
  --xpath '/trace-toc/run[@number="1"]/data/table[@schema="os-signpost"][@category="PointsOfInterest"]' \
  --output signpost.xml >/dev/null 2>&1
The app instructs itself with os_signpost events named TTID and TTFD. Each event is emitted at most once per session. The event-time field in each matching row is nanoseconds since the trace start - which equals the startup duration, because the trace begins at process creation. We extract each value with:
# TTID
xmllint \
  --xpath '//row[signpost-name[@fmt="TTID"]]/event-time/text()' \
  signpost.xml


# TTFD
xmllint \
  --xpath '//row[signpost-name[@fmt="TTFD"]]/event-time/text()' \
  signpost.xml
The numbers – table, Android, milliseconds
| Device | KMP TTID | RN TTID | KMP TTFD | RN TTFD |
| Pixel 7 | 158 | 410 | 660 | 985 |
| Motorola Edge 60 | 245 | 527 | 617 | 993 |
| Huawei P40 Lite | 221 | 838 | 750 | 1535 |
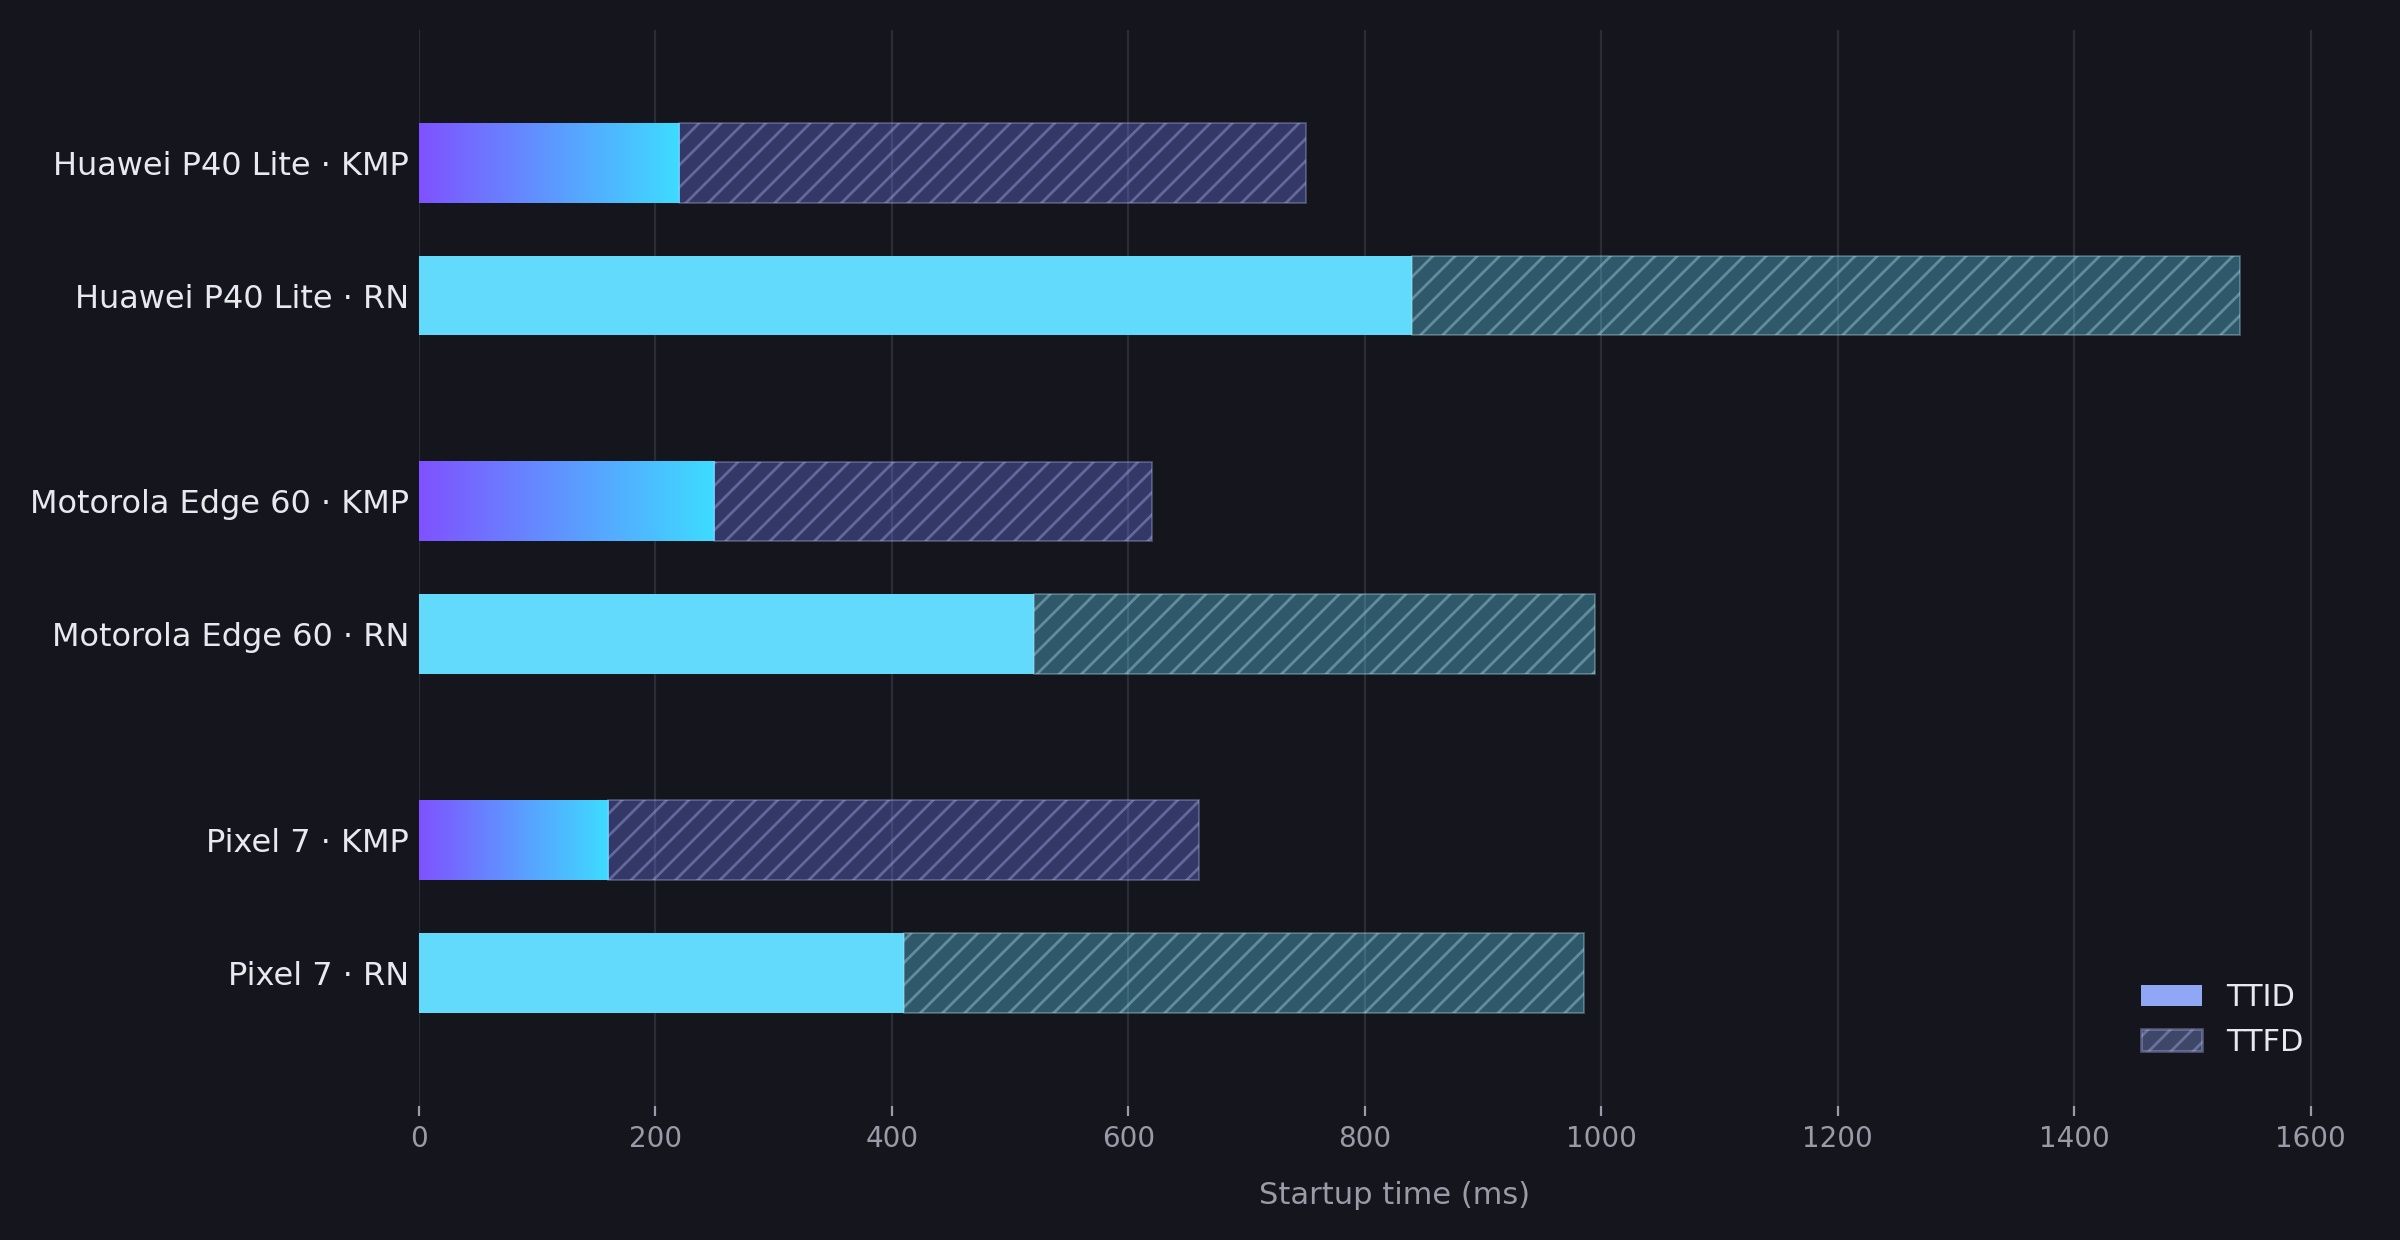
Kotlin Multiplatform reaches the first frame 2-4x faster than React Native.
For KMP, a cold start is a straightforward process launch followed by UI initialization.
For React Native, the JavaScript engine, its bridge, and the JavaScript bundle all have to load before the first frame can appear – a cost that adds around 250-280ms on the Pixel 7 and Motorola Edge 60, and jumps to over 600ms on the Huawei P40 Lite.
The numbers – Table, iOS, milliseconds
| Device | KMP TTID | RN TTID | KMP TTFD | RN TTFD |
| iPhone 13 mini | 870 | 1041 | 1364 | 1555 |
| iPhone 16 | 822 | 850 | 1313 | 1220 |
| iPhone 17 | 802 | 822 | 1203 | 1209 |
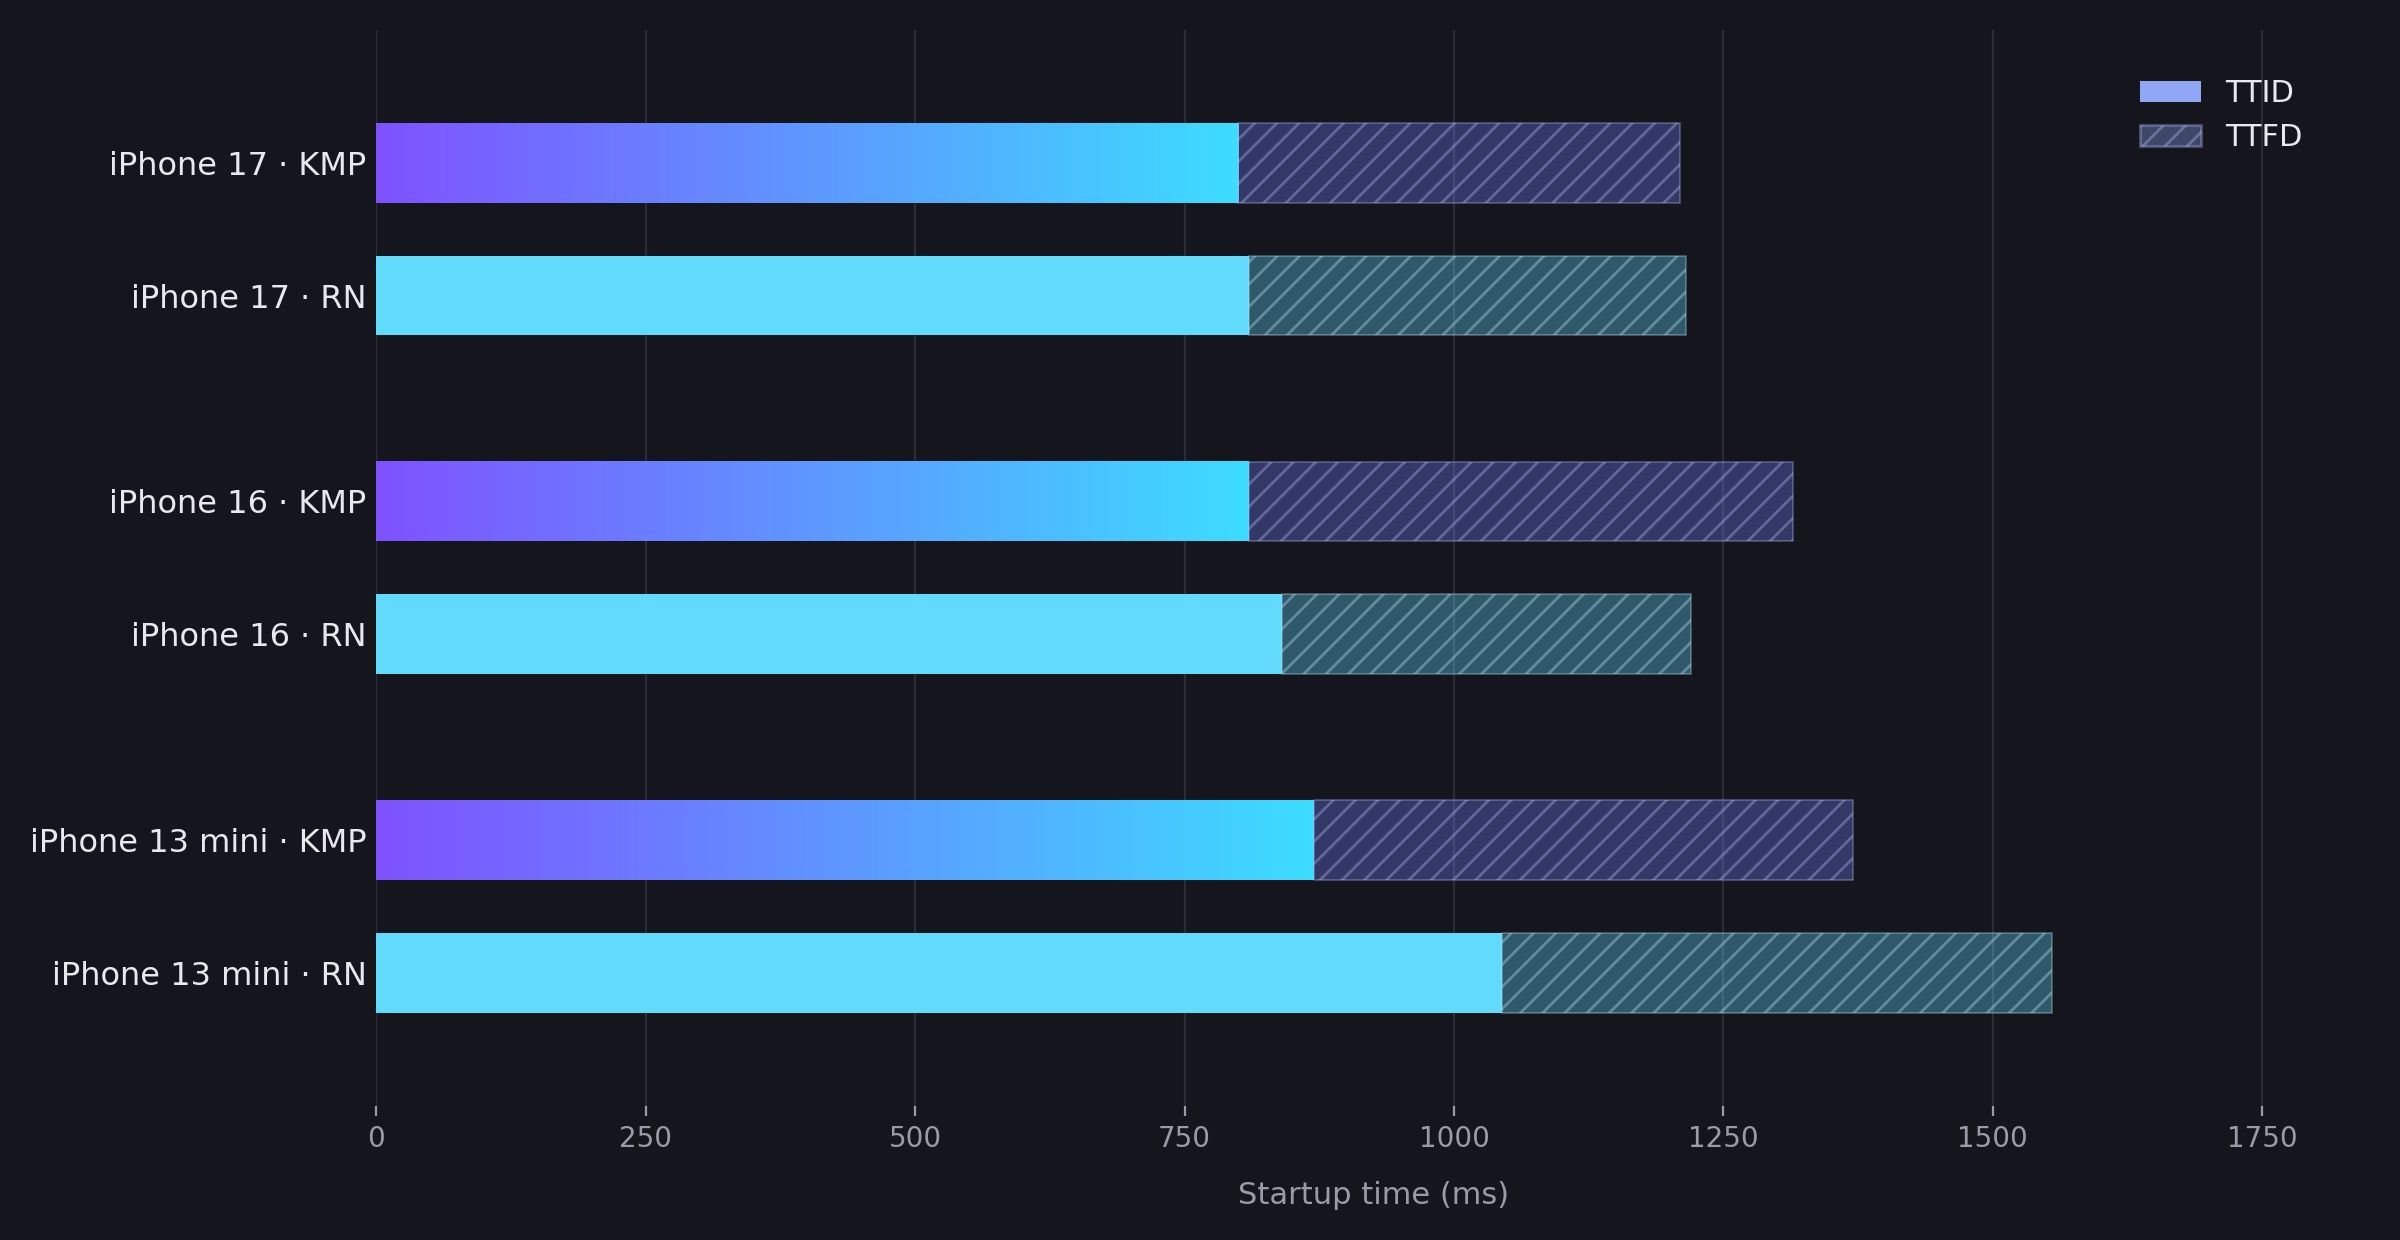
On iOS, the two frameworks are much closer.
For Kotlin Multiplatform, the graphics renderer takes around 800-870ms to start up on every device, with barely any difference between generations.
For React Native, the JavaScript engine starts fast enough on modern Apple hardware that the gap seen on Android disappears almost entirely. On iPhone 16 and 17, the difference on TTID is just 20-28ms. React Native is actually faster on TTFD – by 93ms on iPhone 16 and by 6ms on iPhone 17. The iPhone 13 mini is the only device where Kotlin Multiplatform is noticeably ahead, by around 170ms on TTID and 190ms on TTFD.
Round 3 - RAM usage
RAM measurement is complicated by the fact that Android and iOS expose fundamentally different memory models. Android reports PSS and RSS via its kernel memory accounting; iOS exposes a Clean/Dirty/Compressed breakdown with no direct PSS equivalent and no swap.
What we’re measuring on Android
PSS (Proportional Set Size) – measured as the process's physical RAM footprint, with each shared library's contribution divided proportionally among all processes that have it mapped.
RSS (Resident Set Size) – measured as the total physical RAM mapped into the process, counting shared libraries in full regardless of how many other processes use them.
What we’re measuring on iOS
iOS doesn't use swap. Instead it splits memory into Clean (pageable from disk), Dirty (must be kept in RAM), and Compressed (in-RAM but compressed when idle).
The number reported by Activity Monitor is Clean + Dirty + Compressed – a rough RSS equivalent, which is what we use.
How we measured
The general method is the same as in the previous round: launch the app, start the profiler, run the scenario, stop recording.
This order means application startup is excluded from the recorded samples, keeping the measurement focused on steady-state memory usage during actual use.
On Android, we sampled dumpsys meminfo once per second while the test scenario ran:
adb shell dumpsys meminfo <package_name>The TOTAL PSS: line in the output carries both PSS and RSS in kibibytes. We parse both values, convert to megabytes, and collect them as samples across the scenario. The reported figures are the average and maximum across all samples.
On iOS, we used xctrace with the Activity Monitor template, attached to the running process:
 xctrace record \
    --device <UDID> \
    --template "Activity Monitor" \
    --output output.trace \
    --attach <process_name>
Recording runs until the test scenario finishes, then the trace is exported:
xctrace export \
    --input output.trace \
    --xpath '/trace-toc/run[@number="1"]/data/table[@schema="sysmon-process"]'
The sysmon-process table contains one row per process per sample. Each row carries several size-in-bytes columns; the third is Memory Footprint. We filter rows by process name and collect that value across all samples, then compute the average and maximum in mebibytes.
| Device | KMP avg PSS | RN avg PSS | KMP avg RSS | RN avg RSS |
| Pixel 7 | 120.5 | 232.2 | 253.9 | 358.2 |
| Motorola Edge 60 | 121.0 | 219.2 | 255.5 | 361.6 |
| Huawei P40 Lite | 59.7 | 175.6 | 204.9 | 329.1 |
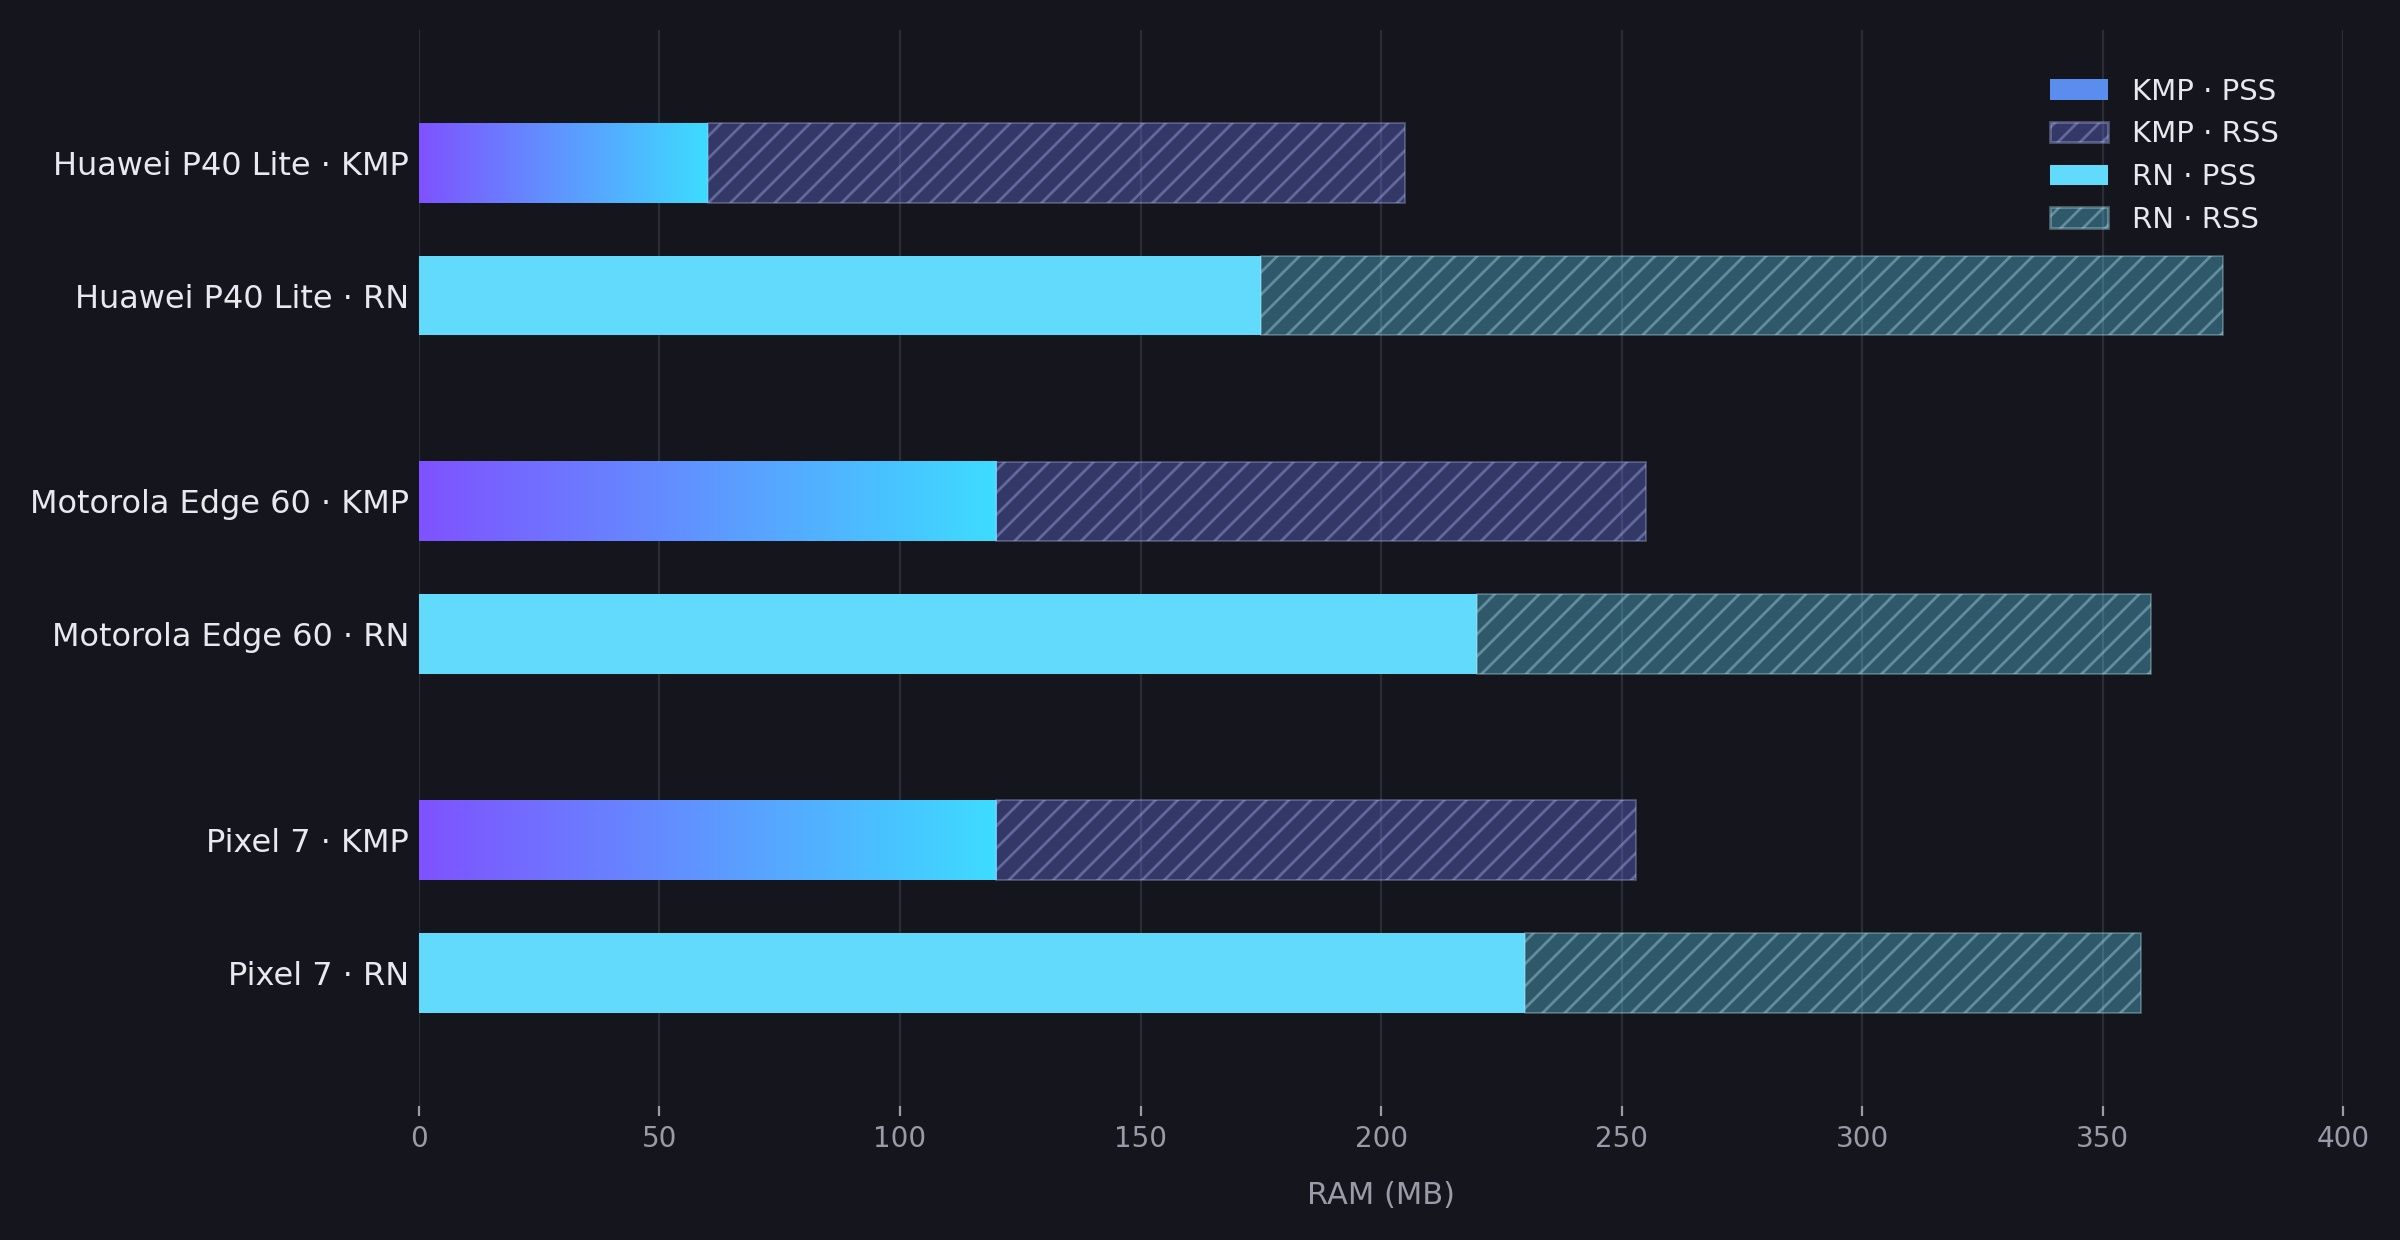
Kotlin Multiplatform uses roughly half the memory of React Native on every tested device. The difference is most visible in PSS, which measures how much memory an app actually owns.
For Kotlin Multiplatform, PSS stays consistent at around 120 MB on the Pixel 7 and Motorola Edge 60, and drops to 59.7 MB on the Huawei P40 Lite.
For React Native, PSS sits between 175-232 MB across all three devices. The JavaScript engine and its runtime stay loaded in memory throughout the app's lifetime, creating a baseline that Kotlin Multiplatform simply does not carry.
The RSS numbers tell a similar story, though the gap is smaller there since RSS includes shared memory that the OS may serve from cache across multiple apps.
The numbers (iOS, MB)
| Device | KMP avg memory | RN avg memory |
| iPhone 13 mini | 157.0 | 44.7 |
| iPhone 16 | 230.2 | 56.4 |
| iPhone 17 | 251.4 | 131.4 |
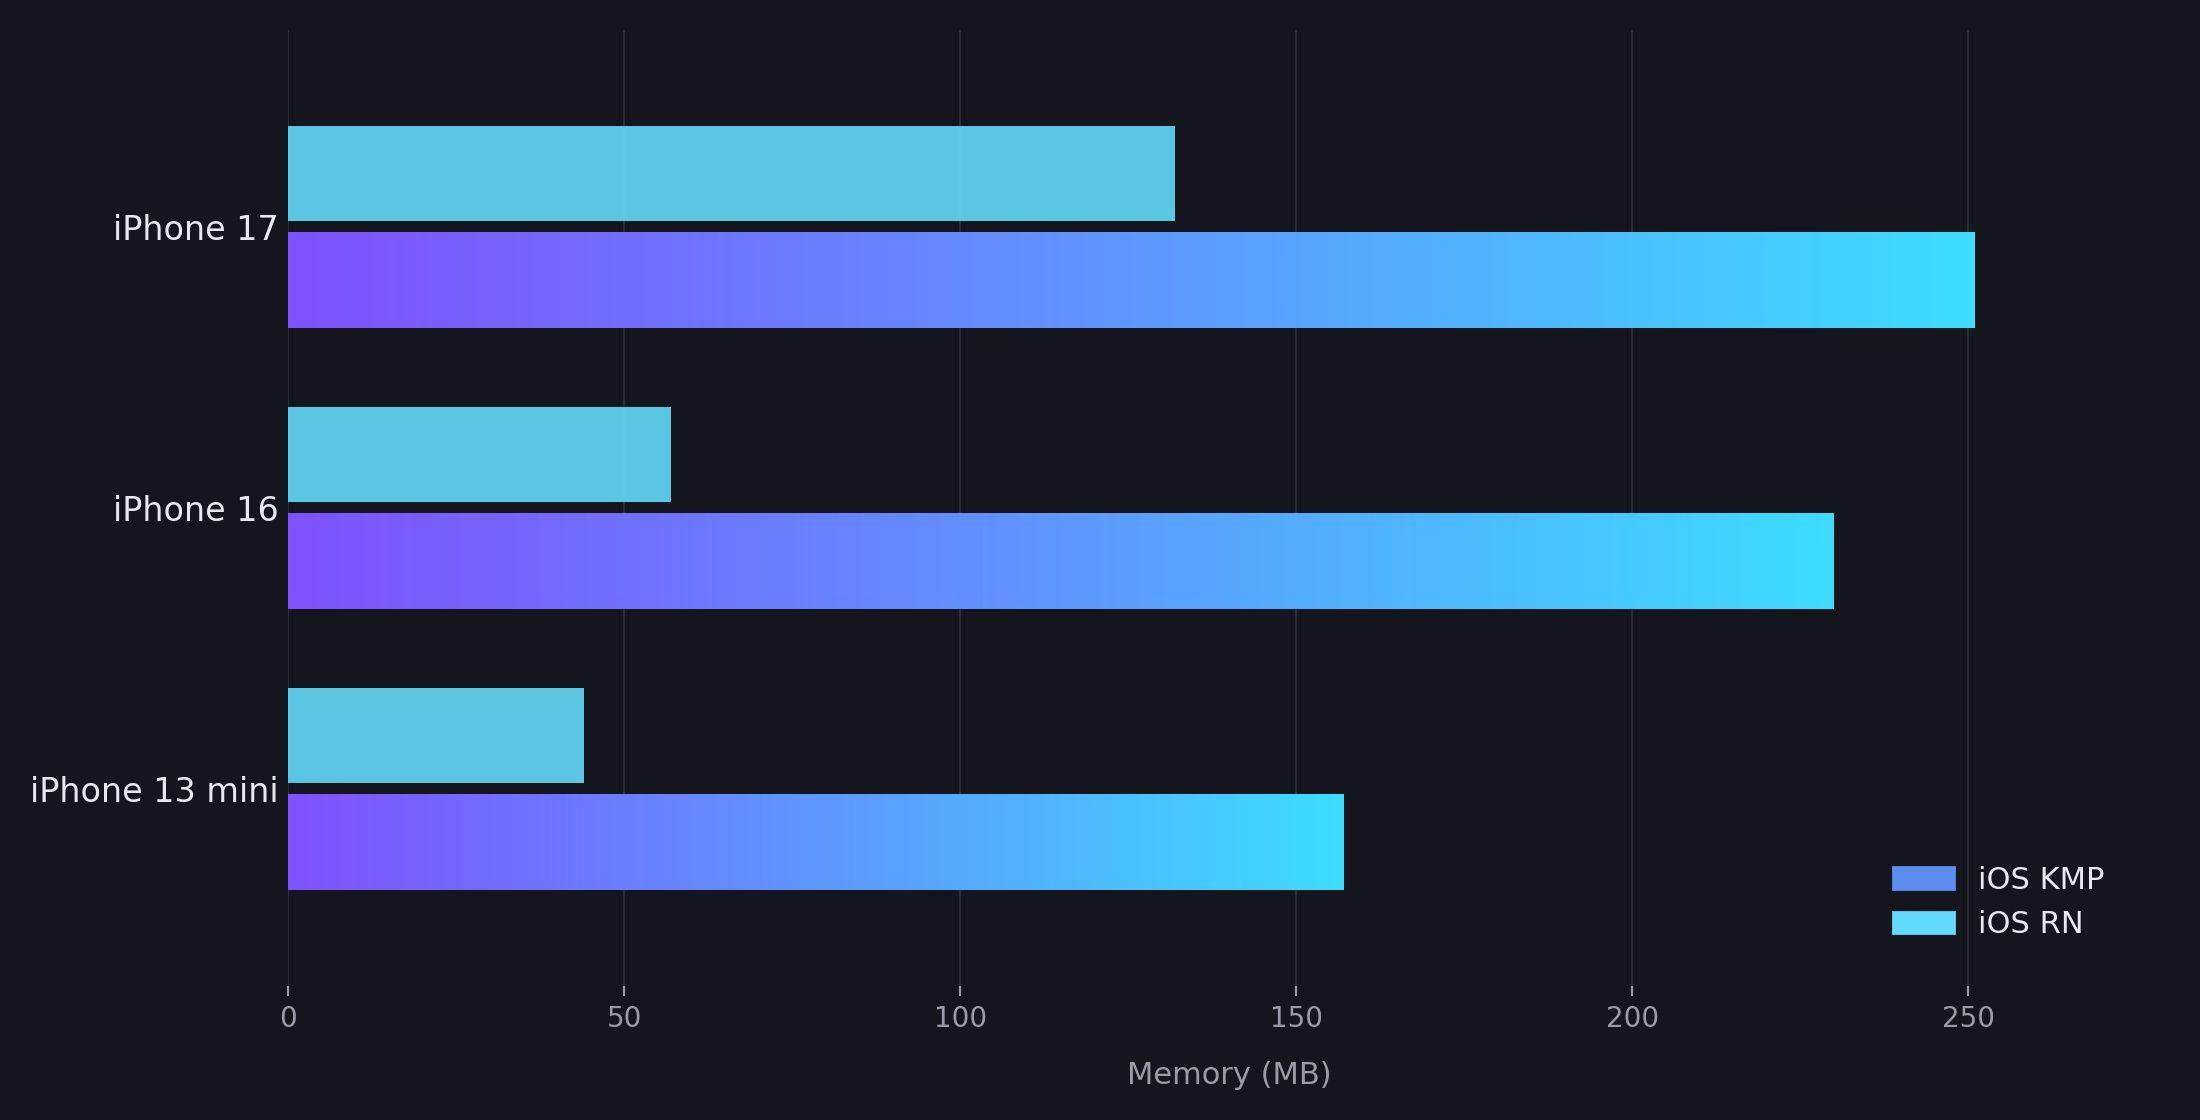
On iOS, the results flip compared to Android. React Native uses significantly less memory than Kotlin Multiplatform on every tested device.
For React Native, rendering is handled by native UIKit, which means the OS manages those resources directly. Memory stays between 44-131 MB across all devices.
For Kotlin Multiplatform, the Skia renderer keeps graphics surfaces and buffers allocated throughout the app's lifetime. That baseline sits between 157-251 MB, growing on newer devices that likely allocate larger render surfaces for higher resolution screens.
Round 4 - CPU usage
Unlike RAM, analyzing CPU usage permitted a consistent approach across platforms – but it came with its own set of issues: it's the least stable parameter we measured, and sensitive to details of the test execution. This was also where the automation overhead had the most influence.
Because of how it behaves, taking the average from a test run doesn't tell us as much. Instead, there is a meaningful “total” we can look at: the sum of CPU cycles utilized by the application process during our test scenario.
We considered other aggregation approaches – average cycles per second, or expressing usage as percentages – but both carry biases, whether on their own or introduced by the extra processing. In the end, we decided to use CPU cycles as the most direct way of describing the amount of work the application has to perform.
How we measured
Finding out how many cycles were used by a process can be done with tools that access hardware performance counters. They’re special registers within the CPU dedicated to counting low-level events like branch mispredictions, cache misses, or cycles, which is exactly what we are looking for.
Similarly to profiling RAM usage, we exclude application startup from the recording.
On Android, the counters can be read with the simpleperf stat command. To get the data from iOS, we used the command line equivalent of Instruments, xctrace, with the "CPU Profiler" template.
The numbers
The results are scaled to billions of cycles:
| Device | KMP avg number of cycles | RN avg number of cycles |
| Pixel 7 | 5,06 G | 8,36 G |
| Motorola Edge 60 | 10,96 G | 9,70 G |
| Huawei P40 Lite | 7,57 G | 8,32 G |
| Device | KMP avg number of cycles | RN avg number of cycles |
| iPhone 13 mini | 2,22 G | 2,39 G |
| iPhone 16 | 2,33 G | 2,04 G |
| iPhone 17 | 2,49 G | 2,25 G |
(shown in billions of cycles for readability)
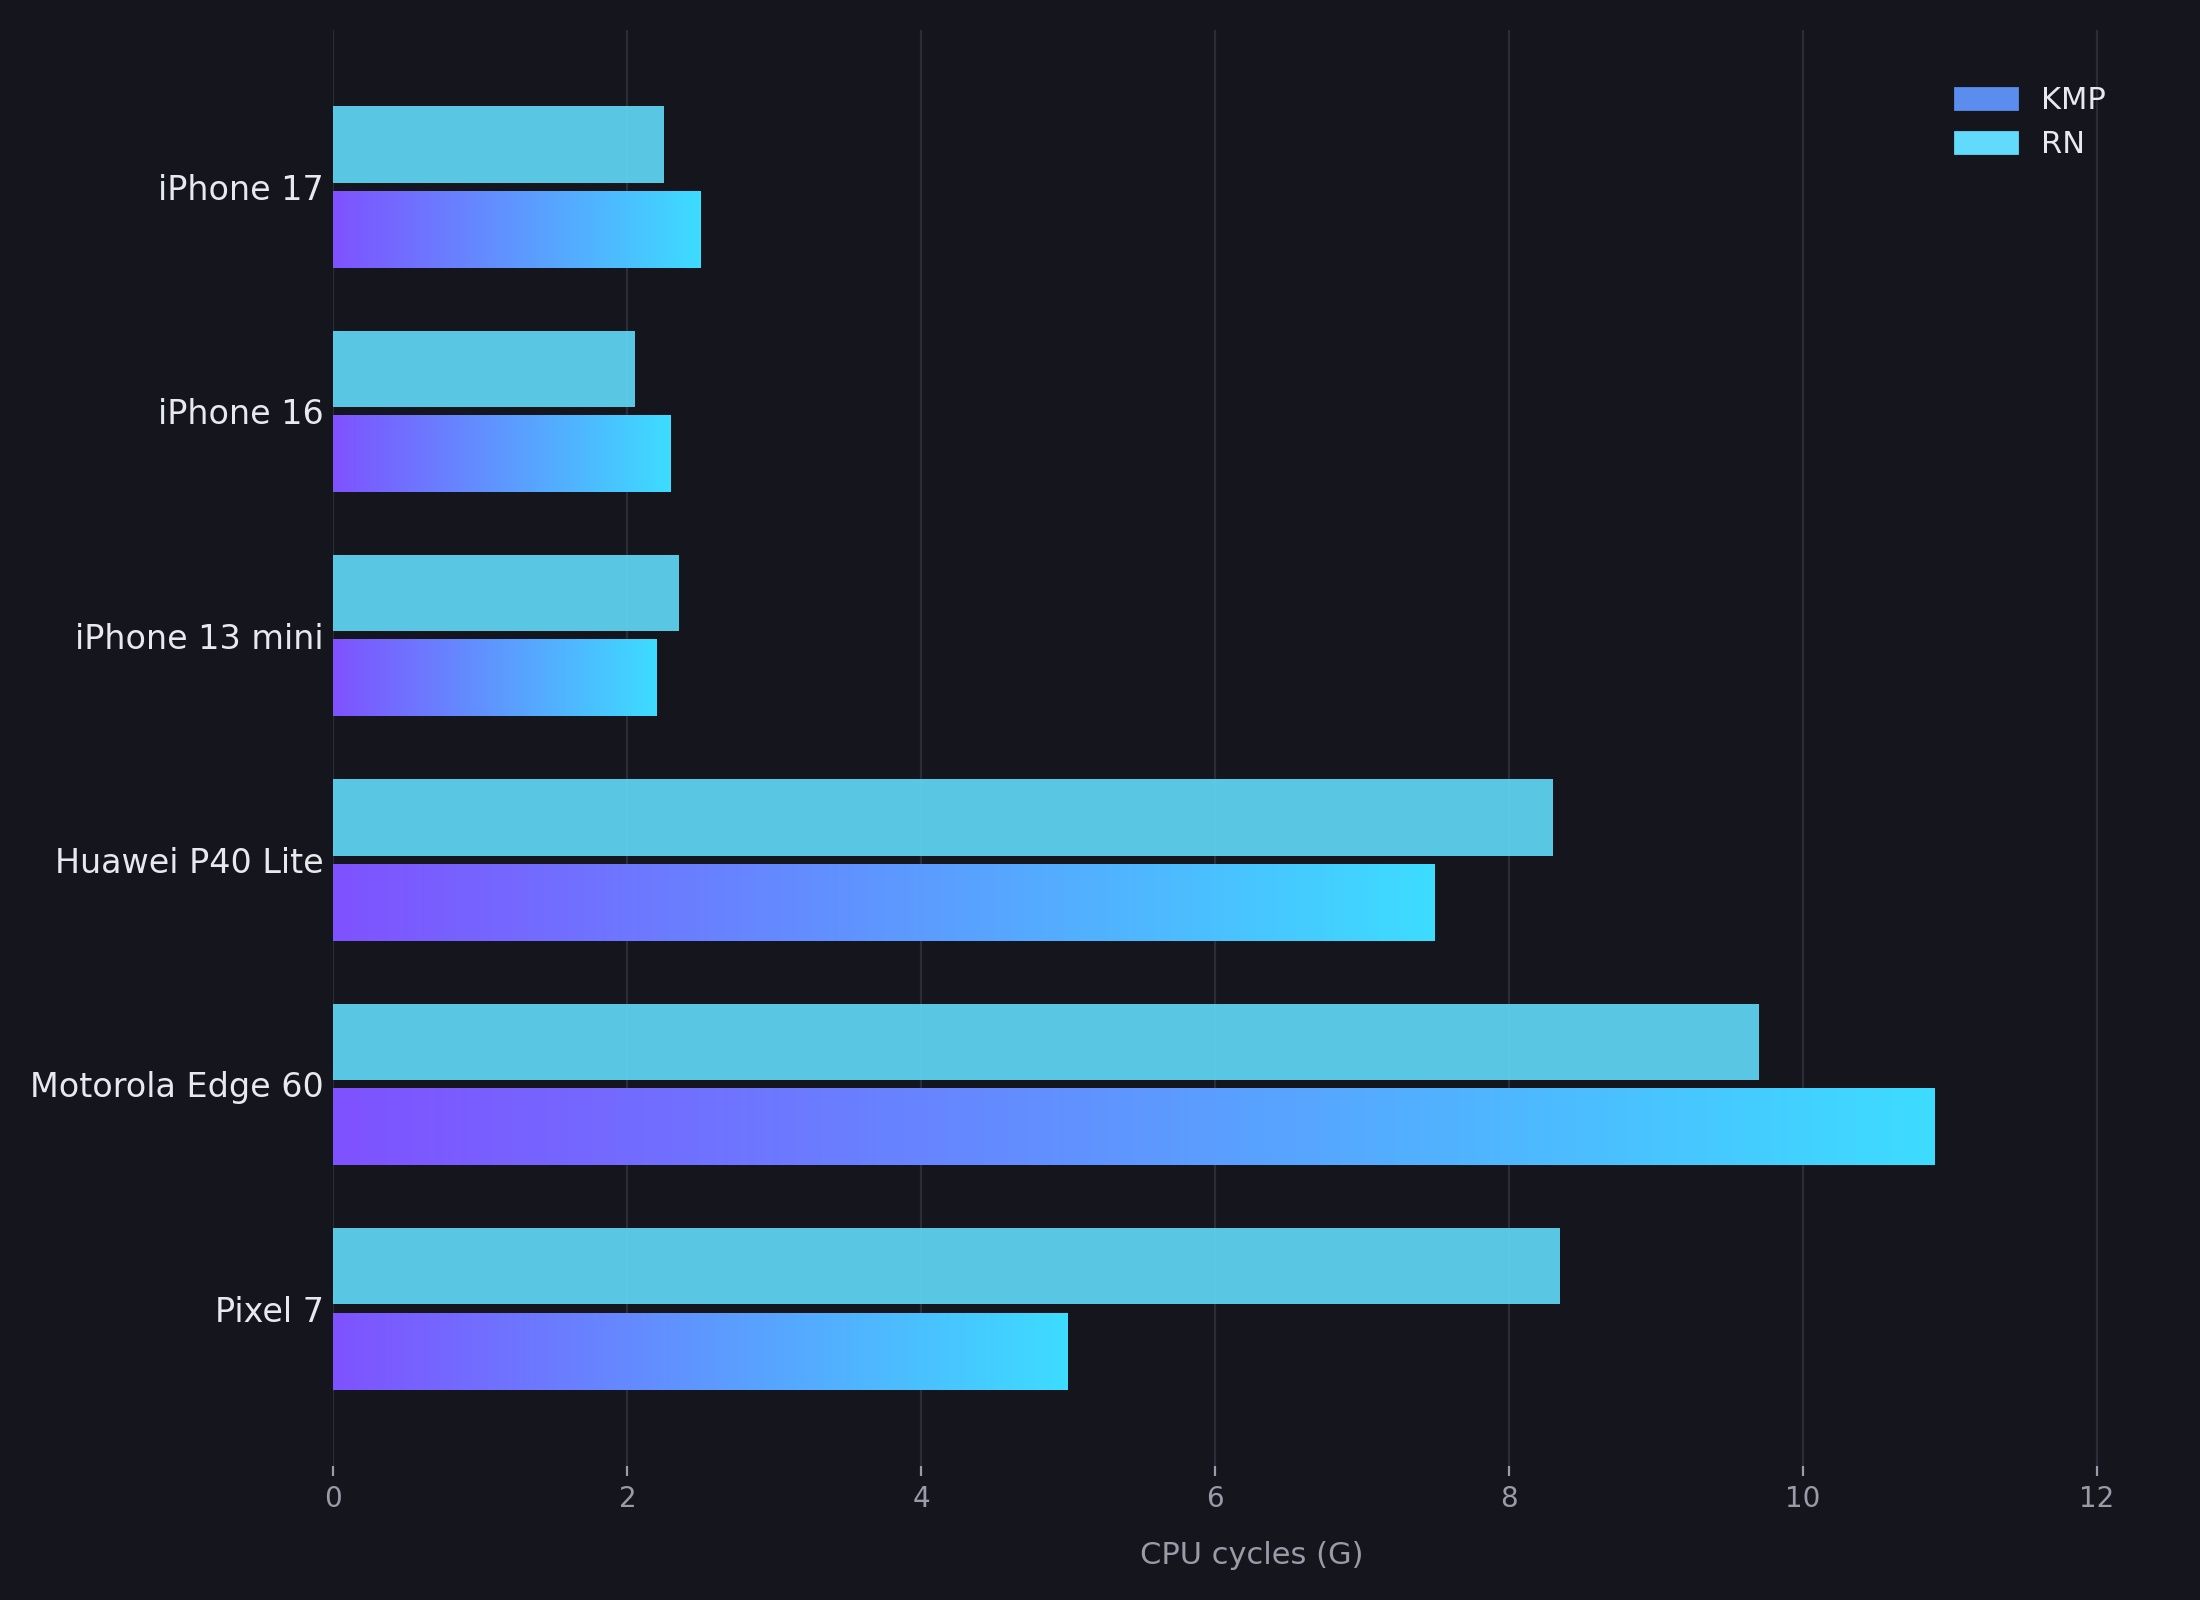
Based on these measurements, neither framework is clearly faster than the other.
More importantly, we must return to the issue of sensitivity mentioned at the beginning: the numbers here reflect a specific test scenario. Within that scenario, results were fairly close across runs on the same device and framework, even accounting for the timing inconsistencies inherent in manual execution. However, we found that variations in the steps could strongly influence the outcome – at times reversing which application came out ahead. The effect could be observed even with something as simple as scrolling speed.
Round 5* – Flashlight (Android only)
We also ran Flashlight, an open-source Android benchmarking tool by BAM. It executes the same test scenario and measures FPS, CPU, and RAM throughout, combining them into a single performance score.
The numbers
| Device | Metric | KMP | RN |
| Pixel 7 | Score | 97 | 99 |
| FPS | 56.7 | 59 | |
| RAM | 201.3 MB | 360.9 MB | |
| CPU | 23.6% | 39.3% | |
| Motorola Edge 60 | Score | 99 | 99 |
| FPS | 58.7 | 59.3 | |
| RAM | 223.9 MB | 343.7 MB | |
| CPU | 24% | 31.4% | |
| Huawei P40 Lite | Score | 98 | 98 |
| FPS | 57.4 | 58.1 | |
| RAM | 216 MB | 348.8 MB | |
| CPU | 21.8% | 43.4% |
The overall scores are nearly identical across all devices. The RAM figures align with our manual measurements from Round 3 - RAM usage. Kotlin Multiplatform stays between 201-224 MB while React Native sits between 344-361 MB across all three devices.
In order to compare CPU we need to look past the average presented by flashlight, for the reasons explained below.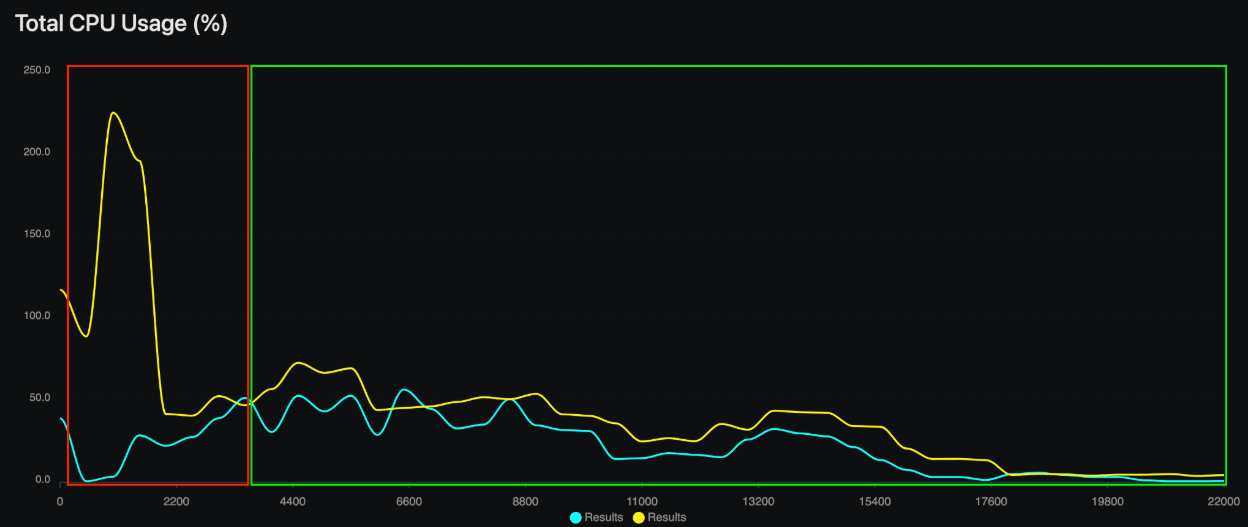
Flashlight measures CPU across the entire run, including app startup. As the graph from the Huawei P40 Lite shows, the startup phase (red) is where the two frameworks diverge most – React Native's CPU spikes sharply during engine boot, pulling its average up. The test scenario itself (green) tells a different story: both lines track closely throughout, which matches what we found in our own CPU measurements. The overall score is pulled down by the startup spike, not by what the app does once it is running.
We cannot compare the Flashlight CPU percentage directly with our cycle counts - they measure different things. But the graph confirms the same conclusion: during steady-state usage, neither framework has a meaningful CPU advantage.
The verdict
Let’s line up the rounds.
| Metric | Android | iOS |
| App size | Kotlin Multiplatform. No JS bundle shipped. R8 prunes everything down to 2 MB vs 15.8 MB. | Tie. React Native is smaller by 1.3 MB, but the difference is negligible in practice. |
| Startup time | Kotlin Multiplatform. Reaches the first frame 2-4x faster across all devices. | Tie. On modern Apple hardware the difference falls within measurement noise. |
| RAM usage | Kotlin Multiplatform. No JS heap means roughly half the RAM of React Native. | React Native. Delegates rendering to native UIKit, avoiding the Skia renderer overhead. Uses 3-4x less memory than Kotlin Multiplatform |
| CPU usage | Inconclusive – varies depending on device and other factors. | Inconclusive – varies depending on device and other factors. |
On Android, Kotlin Multiplatform wins every round, except CPU. The common thread is the absence of a JavaScript runtime: no Hermes to boot, no bundle to load, no JS heap to keep in memory. That single architectural difference compounds across app size, startup time, and RAM usage.
On iOS, the picture is more balanced. Startup time is nearly identical across modern devices, with differences falling within measurement noise. The most notable iOS result is RAM: React Native uses 3-4x less memory than Kotlin Multiplatform, because it delegates rendering to native UIKit while Kotlin Multiplatform keeps the Skia renderer and its graphics buffers in memory throughout the app's lifetime.
Neither framework is universally faster or lighter – they make different trade-offs, and those trade-offs land differently depending on the platform. Performance is one input into a technology decision; developer experience, team familiarity, and ecosystem health matter too. Ultimately, the framework that fits your team and product is the right one.
Open-source repos
- LaunchPerf KMP: https://github.com/software-mansion-labs/launchperf-kmp
- LaunchPerf RN: https://github.com/software-mansion-labs/launchperf-rn